Bad data is expensive. According to Gartner poor data quality costs organizations an average of $12.9 million each year. The bill often hides in plain sight: moving and storing low-quality data, firefighting failed loads, and explaining dashboards that do not match the business.
The bigger risk, though, is in what lies beyond the numbers: wrong decisions and a slow erosion of trust in your data platform.
Think about a sales team planning promotions on a week-old snapshot. Prices are set based on false assumptions; inventory is misallocated, and customers feel the impact of those erroneous decisions. The data might be accurate for last week, yet it is not useful for today.
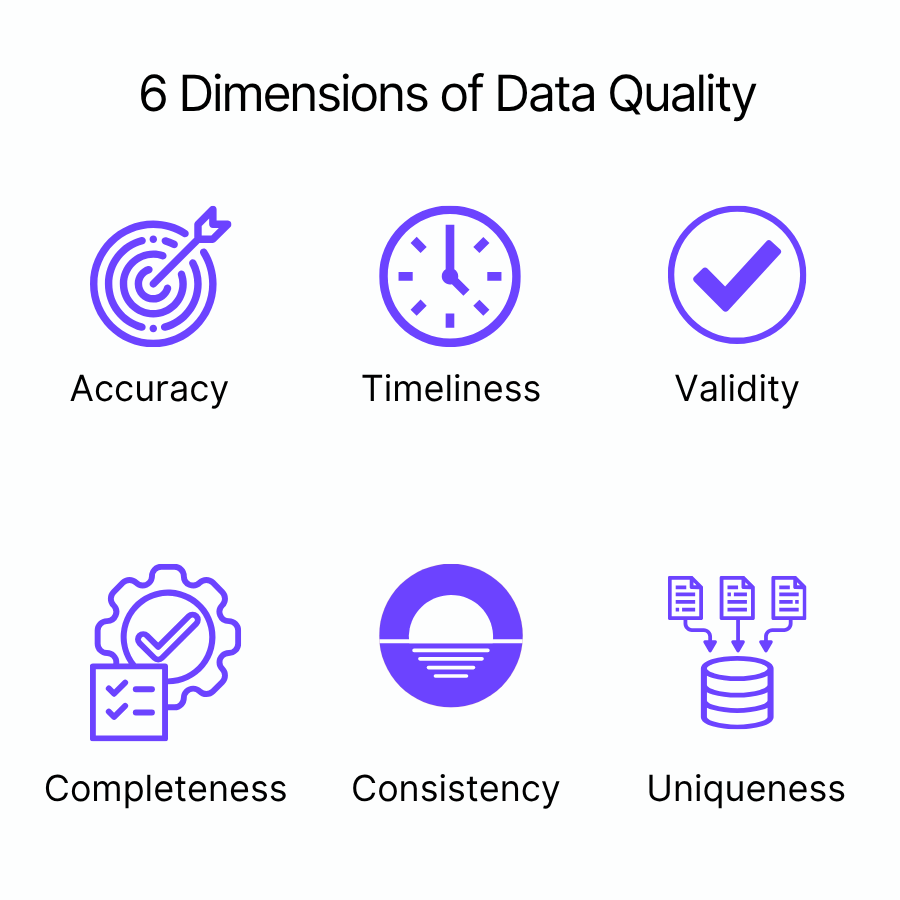
In this article, we are going to cover some important topics that can help you identify and improve problems with data quality. We’ll break it down into six, well, qualities of data quality, accuracy, completeness, consistency, timeliness, uniqueness, and validity, and how to improve each in practice with examples.
The 6 Dimensions of Data Quality
Data quality is a concept that is hard to “measure”. That’s why we can break it down into six dimensions:
1. Accuracy – Is it right?
Accuracy is the foundation of trust. It’s about whether the data represents reality.
I’ve seen revenue figures that didn’t match what they should be because of rounding errors or transformations rules that changed the number when they should not. Accuracy means your numbers tell the truth, and if they prove to not be the case, you instantly lose the trust of your users.
How to improve it:
- Reconcile critical metrics (sales, costs, quantities) against source systems.
- Add validation rules to catch impossible values (negative ages, future dates).
- Validate data before it moves downstream into analytics or reporting layers.
2. Completeness – Is anything missing?
Are there any blank or null values in your data, more specifically in your key fields? I’ve often done a row count of null values in the key fields to see if I'm not bringing any useless data into the dashboards. In my years of working with data projects I’ve seen revenue figures that didn’t match what they should be because of rounding errors or transformations rules that changed the number when they should not, unfortunately this happens way more than it should.
How to improve it:
- Use profiling scripts or monitoring tools to flag missing or empty fields.
- Set thresholds that trigger alerts when completeness falls below expectations.
- You can always “filter out” null values in your transformations to get more quality on your data.
3. Consistency – Does it line up across systems?
This can lead to grave misunderstandings. “Customer Type” might mean one thing on your dashboard and another in your ERP. “Order Date” might refer to creation date in one source and delivery date in another. It is very important to keep the names the same between applications; this way it is easier for the users who are more used to the ERP system to understand your reports/apps.
How to improve it:
- Standardize naming conventions and data types across sources.
- Create mapping tables or master data references to unify business terms.
4. Timeliness – Is it fresh?
Timeliness means whether your data is current enough to be useful. A perfectly clean dataset loses value if it’s a week behind what’s happening in the business. Data can be accurate but still irrelevant if it’s too old.
Availability is one key aspect of Timeliness. If a server outage, failed load, or permissions issue blocks access, your data quality will plummet. Availability includes platform uptime, successful pipeline runs, network/identity access, and inclusion of all critical sources, so dashboards, APIs, and ad-hoc queries work on demand.
How to improve it:
- Track the last refresh date for every dataset and if possible, have monitoring alerts in case it identifies inconsistencies.
- Adopting a high availability cloud is a good solution for that. But now with the recent Amazon outrage in the East-1 region, having a multiple cloud environment is a considerable decision to be made. Of course there are costs involved, but how costly is it for your operation to be halted?
- Display “last update” timestamps in reports to build trust.
5. Uniqueness – Are we avoiding duplicates?
Bad joins can lead to disastrous consequences. Duplicate records are one of the fastest ways to destroy confidence in analytics. Even a small duplication rate can make revenue, customer, or product count unreliable.
How to improve it:
- Apply unique keys or constraints in the ETL or warehouse layer.
- Deduplicate before joining or aggregating data.
- Compare row counts between staging and final tables to detect duplication early.
Even the most seasoned developers can fall victim to a bad join. That is why it is important to have a quality assurance team to keep track of the deployments and the quality of your data.
6. Validity – Does it follow the rules?
Validity ensures your data follows defined formats, domains, and business rules. A field might be filled, but that doesn’t mean it’s valid. And that is where the issue lies. If you don’t have validation rules to identify specific formats in the data, your quality can drop significantly.
Think of a date field that says “202A” or a region code of “N/A.” Technically populated, but practically useless.
How to improve it:
- Define validation rules for every key field, Date field, text field etc.
- Build automated checks that flag anything falling outside of valid patterns.
Data Quality Monitoring: Tools, Dashboards, and Visual Examples
How to Build an Effective Data Quality Dashboard (with Examples)
An effective dashboard answers three questions immediately:
Where are today’s problems? How bad are they? Who owns the fix?
Top summary: overall pass rate, incident count, and SLA breaches (freshness, uptime).
Domain KPIs: Accuracy, Completeness, Consistency, Timeliness, Availability, and Usability.
Rule detail: table of failing checks (rule name, dataset, severity, impacted rows, first seen, owner, Jira/incident link).
Trends: 7/30/90-day lines for key KPIs (freshness lag, duplicate rate, validity error rate) so you can tell if you’re improving.
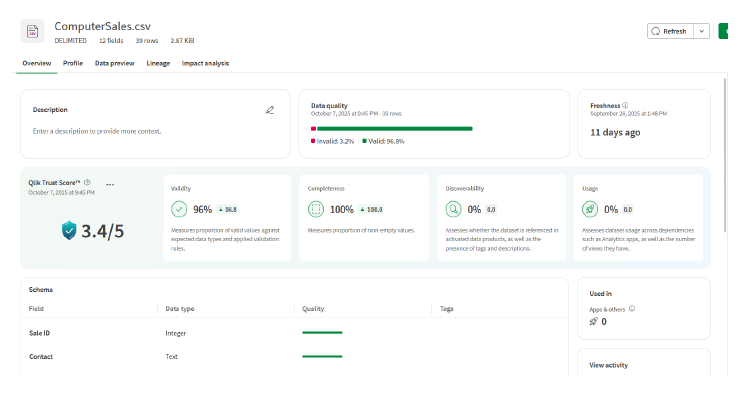
Some data Integration tools like Qlik Talend Cloud have a separate page just for measuring the data quality of your Datasets:
Conclusion
Data quality pays for itself: when Accuracy, Completeness, Consistency, Timeliness, Uniqueness, and Validity are monitored and owned, decisions speed up and trust compounds. Next steps: anchor this in data governance (clear roles + policies), add anomaly detection to catch issues early, and harden your stack for AI readiness with reliable pipelines, lineage, and refresh SLAs.
Ready to Turn Advice into Action?
DI Squared can offer a health check in your data quality, audit your pipelines, fix high-impact data issues, and stand-up monitoring and governance.
Next, read our upcoming blog Part 2: Data Quality Monitoring, Scorecards, and Anomaly Detection to see how to track it daily...
.jpg)