The Four Pillars of Healthcare Data Management and Analytics
Healthcare organizations – providers of all sizes, payers across the country and globally – are generating more data than ever before. A single hospital can generate 4PB of data per month, according to research from the World Economic Forum. From electronic medical records to claims data and patient satisfaction surveys, the volume of information is growing every day. The challenge is to "productionalize” that data and turn it into insights that support the four Cs: care, costs, compliance, and choice-making across the organization – and to do so while managing security.
It goes almost without saying that to get value from data, payers and providers need to set a clear vision for their companies. As we said in a previous blog, a phased approach to data maturity is a normal and necessary part of growing.
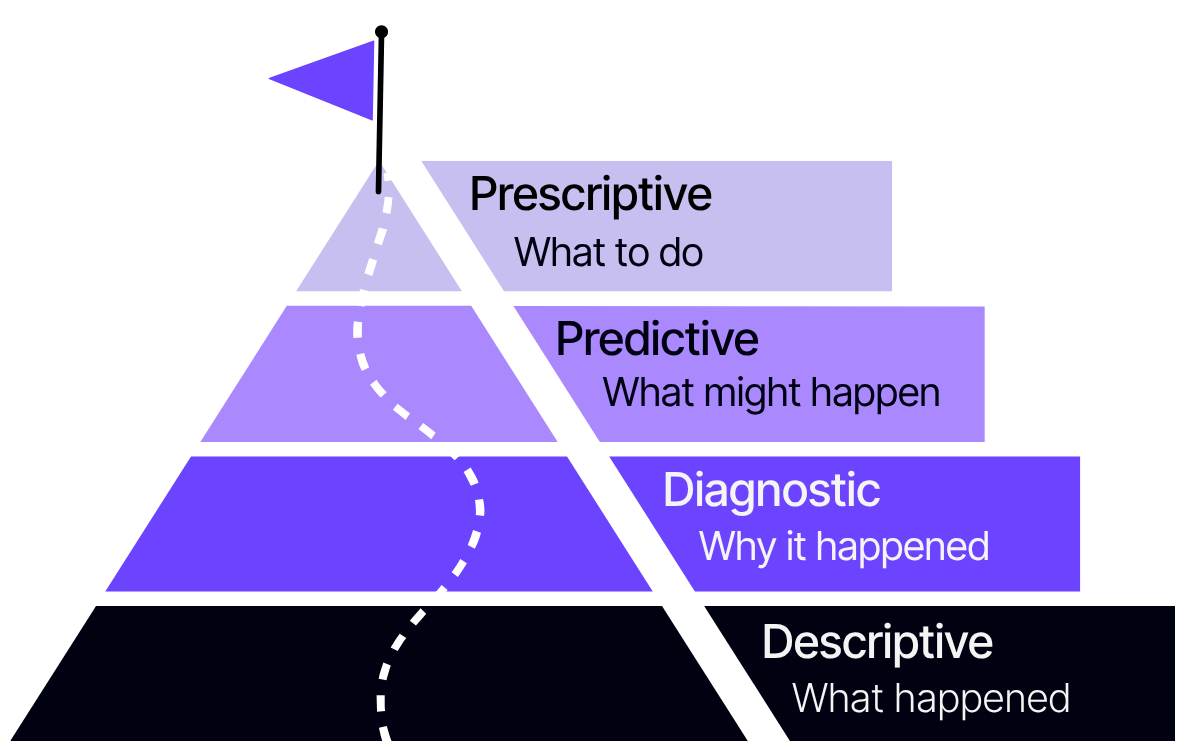
In this blog, we'll take some time to lay out the four core types of analytics: descriptive, diagnostic, predictive, and prescriptive and how each serves you, within the context of real-world scenarios. Each type serves a different purpose and builds on the one before it.
This blog is for beginners looking to get started and for more mature organizations that are looking into the benefits of predictive/prescriptive analytics, ML applications, and the like. We’ll zoom in on AI applications for the four types, too.
Let’s get into the different pillars.
TL;DR: Descriptive analytics looks at what has happened. Diagnostic analytics explains why it happened. Predictive analytics helps forecast what might happen next. Prescriptive analytics recommends what actions to take.
Descriptive Analytics: The What
Creating a data foundation for descriptive analytics is non-negotiable for any organization, and more so when we think about the precarious nature of healthcare and other high-risk sectors, where security and compliance standards are high and sensitive data is constantly on the move. This is our opportunity to create a foundation for security, compliance, and governance. Setting this stage now will yield many benefits in the future.
This is where it all begins. But what exactly are descriptive analytics?
The name says it all: We’re describing what already happened. That’s it. And while it might sound basic, it’s actually critical.
Traditionally, descriptive analytics are delivered through reports, but can also include dashboards, KPIs, and other forms. And yes, you can build fancy dashboards with slick filters and visuals, but at the end of the day, you’re still just looking at the past. That’s not a bad thing. Looking back helps you understand performance, track trends, and start asking better questions. You can’t improve what you don’t measure, and descriptive analytics have the power, in that sense, to anticipate future performance and outcomes, especially when tracked against organizational goals. It’s the first stop on the analytics journey, and it sets you up for everything that comes next.
Take, for example, flu season. Suppose your team is reviewing last year’s flu season. Ready access to descriptive analytics makes it easy to:
- Track average ED wait times by day and shift.
- Compare visit volumes among clinics and departments.
- Map trends in patient satisfaction alongside resource utilization.
- Segment outcomes across different age groups or risk profiles.
- Compare outcomes against KPIs.
But here’s the catch: It only works if your data is clean, well-structured, and secure. If your EHR data is a mess or your billing system doesn’t line up with your encounter data, you’re going to get a lot of headaches. You need accurate, consistent data feeding your reports, otherwise the insights won’t be worth much. Once and only once the foundation is in place, you can start slicing things by location, date, provider, or whatever helps drive the right conversations.
Where AI Fits into Descriptive Analytics
Tools like Power BI and Qlik make this simple. People on the ground can ask real questions in plain language like “How many flu-related visits did we have last January?” and get responses immediately. No need to open a ticket or wait for a report. By using Natural Language Processing (NLP), we can type a question into a prompt and get results back. Very helpful when you have a question of the data, but don’t know what graph will give you the insights you need.
Diagnostic Analytics: The Why
Once you’ve got a handle on what happened – that’s your descriptive analytics – it’s time to dig into why it happened. That’s where diagnostic analytics come in. We’re now in a good position to figure out “why”. This stage is all about uncovering the root causes behind your numbers, not just reporting them. In healthcare, that means asking questions like, “Why did our ED wait times spike last winter?” or “What drove that sudden drop in patient satisfaction scores?”
Let’s go through an example.
Say you notice your emergency department was overwhelmed during flu season. Descriptive analytics tells you how bad it was: how many patients, how long they waited, how satisfaction dipped.
Diagnostic analytics goes deeper. You might slice the data by shift, by provider, location, or by patient type to see if certain groups were hit harder. Maybe you discover that most of the extra visits came from a specific neighborhood, or that staffing levels didn’t keep up with the surge. Perhaps there was a bottleneck in lab processing, or a particular day of the week was worse than others. Or perhaps these high visits were mainly patients who had the flu or flu-like symptoms.
The tools here are more advanced – think drill-down reports, interactive dashboards, and even some basic clustering or correlation analysis. The goal is to move beyond “what” and start answering “why.”
And in healthcare, getting to the “why” is how you start making real improvements whether that’s adjusting staffing, changing workflows, or targeting community outreach.
Bottom line: Diagnostic analytics takes the foundation built by descriptive analytics and uses it to uncover the stories behind your data. It’s where you stop guessing and start solving.
Where AI Fits into Diagnostic Analytics
AI really earns its keep in the diagnostic stage. Let’s say your ED is seeing a spike in visits, but most of them are low-acuity... nothing urgent. You know the numbers are up, but now you need to figure out why. This is where AI can step in and help surface patterns.
You can use clustering to group similar types of visits. Maybe the majority of these patients live along a certain bus route that drops them right outside your door. Or AI might flag that a bunch of them came in multiple times last month – it’s not hundreds of new patients, it's the same folks coming back.
AI helps you connect the dots faster. It’s not magic, but it can save you hours of digging by flagging patterns that would take way longer to find manually. In a busy healthcare setting, speed matters.
How do you get here? Simply push. Push analysts to dig deeper. Ask difficult questions of your data, and don’t settle. By being challenging, it will drive analysts and developers to take the next step and use more advanced tools and techniques.
Predictive Analytics: The When
Now that we’ve got a handle on what happened (descriptive analytics) and why it happened (diagnostic analytics), we’re ready for the next level: predictive analytics. This is where we use data to look ahead and try to figure out when something is likely to happen so we can be ready, not just reactive.
Let’s say you’re the new CEO of a hospital, and it’s summer. You look back at last year and notice patient satisfaction tanked in the winter, and clinic wait times were unusually long. You ask your analytics team to dig in, and they tell you flu season hit hard, you were understaffed, no one saw it coming. The big question: Why couldn’t you predict it?
Predictive analytics will get us past this. If you’ve done the work to build a solid data foundation that’s clean, organized, and reliable, you can start feeding that data into models that spot patterns and trends. This will allow us to more precisely add staff and other resources, so we can serve our patients efficiently and effectively. For example, you can pull together historical data on flu cases, weather patterns, school absences, even local events, and train a model to predict when flu season is likely to start in your area. The better your data, the better your predictions.
With this kind of insight into when flu season will start, you can plan ahead and ramp up staffing, stock up on supplies, adjust schedules before the surge hits...not after patients are already lined up in the waiting room. We're turning hindsight into foresight.
Where AI Fits into Predictive Analytics
Using AI can speed up the process and add greater precision than if the work were done manually – and we can update and adjust those models quickly, based on fluid conditions. They can spot subtle signals; e.g., maybe a certain zip code always sees flu cases first.
But here’s the key: predictive analytics is only as good as the data you feed it. If your data is messy or incomplete, your predictions will be too. That’s why getting descriptive and diagnostic analytics right is so important. They set the stage for everything that comes next.
How do you get here? In this case, tools can get expensive, so do your homework and shop around. Organizations pilot 37 AI tools and only implement 5 on average, according to IDC, and over 500 AI startups cropped up in 2023-2024 alone. I highly recommend getting help in this stage. Solicit professional help from a consulting firm, such as DI Squared. Consultancies can help you build use cases, select tools for your use cases, and help you execute your projects.
The challenge here is that if you get started off on the wrong foot, it will get very expensive to make a course correction.
Prescriptive Analytics: The What-to-Do
Prescriptive analytics is the top of the analytics pyramid, the place where all your hard work pays off. You’ve already answered “what happened” (descriptive), “why it happened” (diagnostic), and “when it might happen or happen again” (predictive). Now, prescriptive analytics tells you what to do about it.
Let’s stick with the flu season example. By this stage, you know flu cases are coming, you know why last year was rough, and you have a good idea when the surge will hit. Prescriptive analytics takes it a step further: it gives you actionable recommendations. It might tell you exactly how much extra vaccine to order, when to bring in temporary nursing staff, or how to adjust clinic hours to handle the expected patient load. It can even suggest changes to your supply chain, staffing models, or patient flow—whatever “levers” you can pull to stay ahead of the curve.
But it doesn’t stop there. Prescriptive analytics can also forecast the impact of those changes. If you follow its recommendations, how much will wait times drop? How much will patient satisfaction improve? You’re not just reacting at this stage. You’re proactively shaping outcomes based on solid data.
AI/ML is a natural fit here. It can crunch through all your options, simulate different scenarios, and recommend the best path forward far faster and more accurately than a manual process irrespective of the activity: You could be optimizing staffing, managing supplies, or predicting patient clusters.
How do we get here? The maturity to this last pilar is similar to that of the second pilar: Push. As a leader, be challenging and supportive of the team. An investment in some tools is going to be necessary, and your team will need some additional training.
That said, this step isn’t as big a step as it is to go from Diagnostic to Predictive.
At this point, we have our data foundation well built, so now it’s a matter of asking the right questions and choosing the right use cases.
The Road to Prescriptive Analytics
Getting to the top of the pyramid isn’t quick or easy. Rome wasn’t built in a day.
In this blog, we went through a scenario to strategically add resources to help us progress through our analytics maturity journey, and we methodically added the needed tools to support our growth. And when you get it right, you’re not just reporting on the past or guessing about the future, but rather using data in the right way to make better decisions. Remember: This isn’t just a set of “pillars”. It’s a maturity journey. Every step builds on the last, and each one takes time, resources, and the right technology.
You need clean, well-organized data from your descriptive and diagnostic stages, and reliable predictive models to forecast what’s coming. Only then can you trust the recommendations that prescriptive analytics delivers.
How DI Squared Helps You Become a Healthcare Data Star
It takes a solid data foundation, the right tools, and a team that knows how to ask the right questions. Partnering with a solid consultancy means you’ll have staff that’s there for you when you need them, and help you through your journey, no matter where you are now.
Drop us a line to start building your personal data maturity pyramid.
.jpg)