Data Governance, Anomaly Detection, and Data Quality Operations
In Part 1, we broke data quality into six dimensions: Accuracy, Completeness, Consistency, Timeliness (and Availability), Uniqueness, and Validity, and showed practical ways to improve each one. We also discussed how to monitor these dimensions with dashboards and data quality KPIs, so teams can quickly see where problems are, how severe they are, and who owns the fix. With this foundation in place, we’re ready to go a level deeper into governance, anomaly detection, and ongoing data quality operations.
What You’ll Learn in This Blog
- How data governance, ownership, and clear standards strengthen data quality, integrity, and trust across your key domains.
- How to run ongoing data quality operations through audits, cleansing, monitoring, and anomaly detection to prevent issues and fix root causes.
- How metadata, lineage, and structured health checks prepare your organization for reliable analytics and AI by benchmarking quality and building a practical improvement roadmap.
What is the Role of Data Governance in Improving Data Quality
Data governance is about clarity and consistency. It improves quality by defining who owns which data, what “good” looks like, and how changes are made in a controlled way. When ownership, definitions, and decision rights are explicit, teams stop arguing about the source of truth and start fixing real issues.
Start with a minimum viable approach by naming data owners and stewards for your most critical domains. Having plain-language definitions of your top metrics helps people understand and define them, and to create a simple change process for schemas/business rules and document lineage so people see how data flows. Here are some practices that you can start implementing today:
Best Practices for Maintaining Data Integrity and Trust
Maintaining data integrity and trust is a continuous discipline: defining quality standards, monitoring, fixing issues at the root, and making ownership explicit.
- Governance - Roles, policies, and decision rights. Clear ownership and thresholds for what “good” means. You need to have a “Quality Standard” and monitor if the engineers are following the best practices.
- Operational controls - Profiling, validation, matching/deduplication, key enforcement, freshness, SLAs and schema contracts.
- Transparency - A shared glossary, visible “last updated,” and lineage that can be followed by a non-engineer. And even better if the glossary contains the business rules being used for each metric.
How to Conduct Regular Data Audits and Data Cleansing
Regular audits start with data profiling to understand distributions, anomalies, and rule violations; follow with issue logging and KPI tracking (e.g., completeness, uniqueness, validity), then prioritize fixes by business impact. Cleansing should not just “correct” data; it should address root causes and push controls as close to ingestion as possible, so recurring errors are prevented and not just cleaned later.
- Evaluate rules - Measure the six dimensions (Accuracy, Completeness, Consistency, Timeliness/Availability, Uniqueness, Validity) against explicit thresholds.
- Log issues as data - Treat each failure as a record with a timestamp, severity, impacted rows, and the owner. If it’s not logged, it will be forgotten.
- Prioritize by impact - Not all errors are equal, so separating them by priority might be a good idea. An executive dashboard error that drives pricing decisions is different from a minor label mismatch on a rarely used page.
- Fix at the root - Cleansing that only corrects outputs guarantees a future relapse. The ideal scenario is to have controls as close to ingestion as possible, source app validation, mapping tables owned by the business, so problems like this do not come to the surface.
- Prevent recurrence - You had an incident, but what are you going to do to prevent the same error or a similar happening? Learn from the mistake and have a plan for it, be it a new validation rule or a guardrail on the database.
The Role of Metadata Management and Data Lineage in Maintaining Quality
Metadata (business glossary, standards, and rules) gives teams a shared language for what each field means and how it should look; lineage shows where data comes from, how it changes, and where it is used. Together, they make audits faster and accelerate root-cause analysis. In most frameworks, metadata and lineage sit inside governance, enabling consistent definitions across systems and supporting quality controls across dimensions like accuracy, validity, and timeliness.
Data Quality Monitoring
Monitoring is where quality becomes visible. The most effective programs use a small set of clear indicators, updated every refresh, with trends and ownership attached. A practical approach includes:
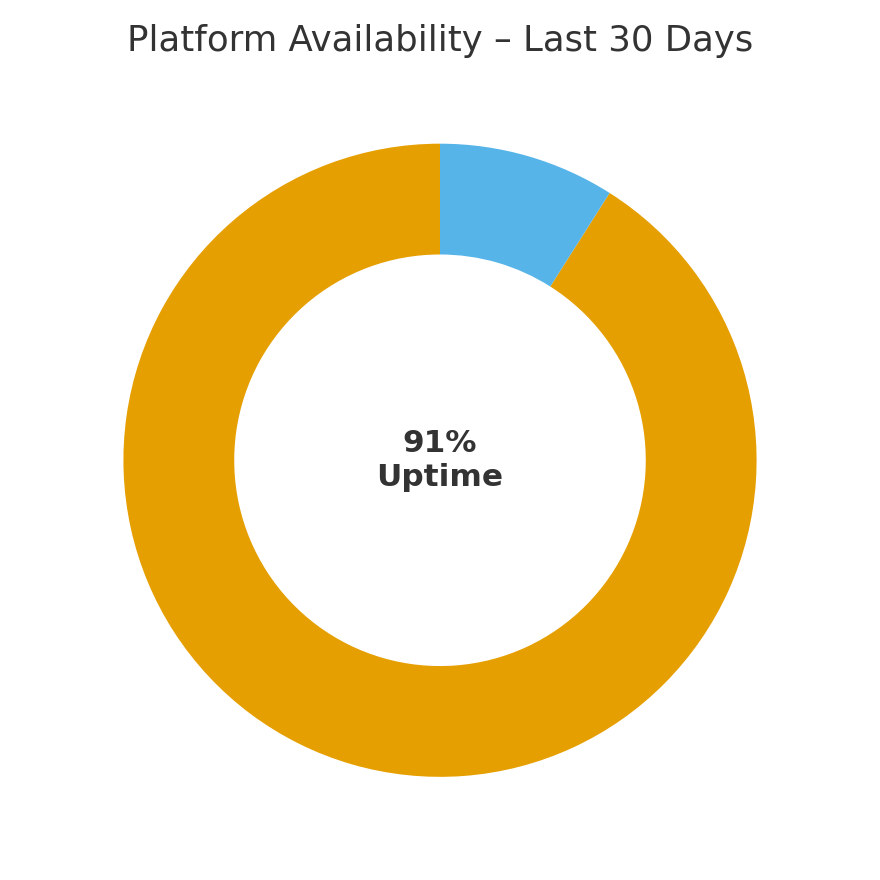
- A concise scorecard - Track a handful of KPIs per dataset that correspond to the six dimensions, percent nulls for completeness in critical fields; duplicate rate for uniqueness; variance vs. source totals for accuracy; last refresh age and uptime for timeliness/availability and format/domain adherence for validity.
- A failing rules table - List every rule breach with the metric value, the threshold, severity, owner, first seen, last seen, and the link to the ticket. Sort by severity and time open. This is your control tower.
- Ownership in the UI - Every card shows who is accountable and where to raise an issue. When ownership is visible, follow-through improves.

Monitoring is not just about detecting problems; it is also about proving reliability. Over time, the trend line becomes a story you can tell leadership: fewer incidents, quicker time to resolution, higher Trust Scores on critical datasets.
What is Anomaly Detection and How Does It Help Monitor Data Quality?
Anomaly detection flags unexpected deviations in your data or pipelines, sudden drops in record counts, a spike in nulls, or freshness lag beyond its normal range. At a basic level, you compare today to historical baselines (rolling averages with seasonality), then alert when a metric falls outside an adaptive band.
A pragmatic approach is best:
- Use rolling baselines that account for seasonality and day-of-week patterns, the goal being to understand persisting issues. If you are getting alerts every Saturday after midnight, it means that something in your process is getting overloaded and consequently failing subsequent tasks. A control chart helps you understand patterns over time:

- Require persistence (e.g., two consecutive breaches) to reduce alert fatigue. You don’t want 100 emails every hour.
- Combine with thresholds. Even if a metric is within its historical band, it should still alert if it crosses an absolute red line (for example, more than 5% nulls in a required ID).
Apply anomaly detection where it pays off most: daily row counts by entity and date, null rates for business-critical fields, duplicate rates for composite keys, freshness compared to SLAs, and, when you’re ready, the distributions of features that feed your ML models. This is about catching trouble while it is still small and cheap to fix.
Data Lineage
Data lineage is the practice of mapping and visualizing how data moves from its original source to where it is used today, including every change it goes through along the way. It allows you to see exactly where a given data point originated, at which points it split or combined with other datasets, and which transformations were applied to it, from the moment it was first captured to its final use in reports, analytics, or applications.
Lineage becomes powerful when it is used in daily operations. Two practical patterns elevate its value:
- From incident to lineage - When a rule fails, the incident record links directly to the lineage view for that dataset and time window. With lineage, it becomes very easy to find out the root issue.
- From change to impact - When a change request is submitted, like a field is being renamed, lineage surfaces all downstream dependencies and associated quality rules. Owners can update definitions, adjust thresholds, and schedule communications before anything breaks.
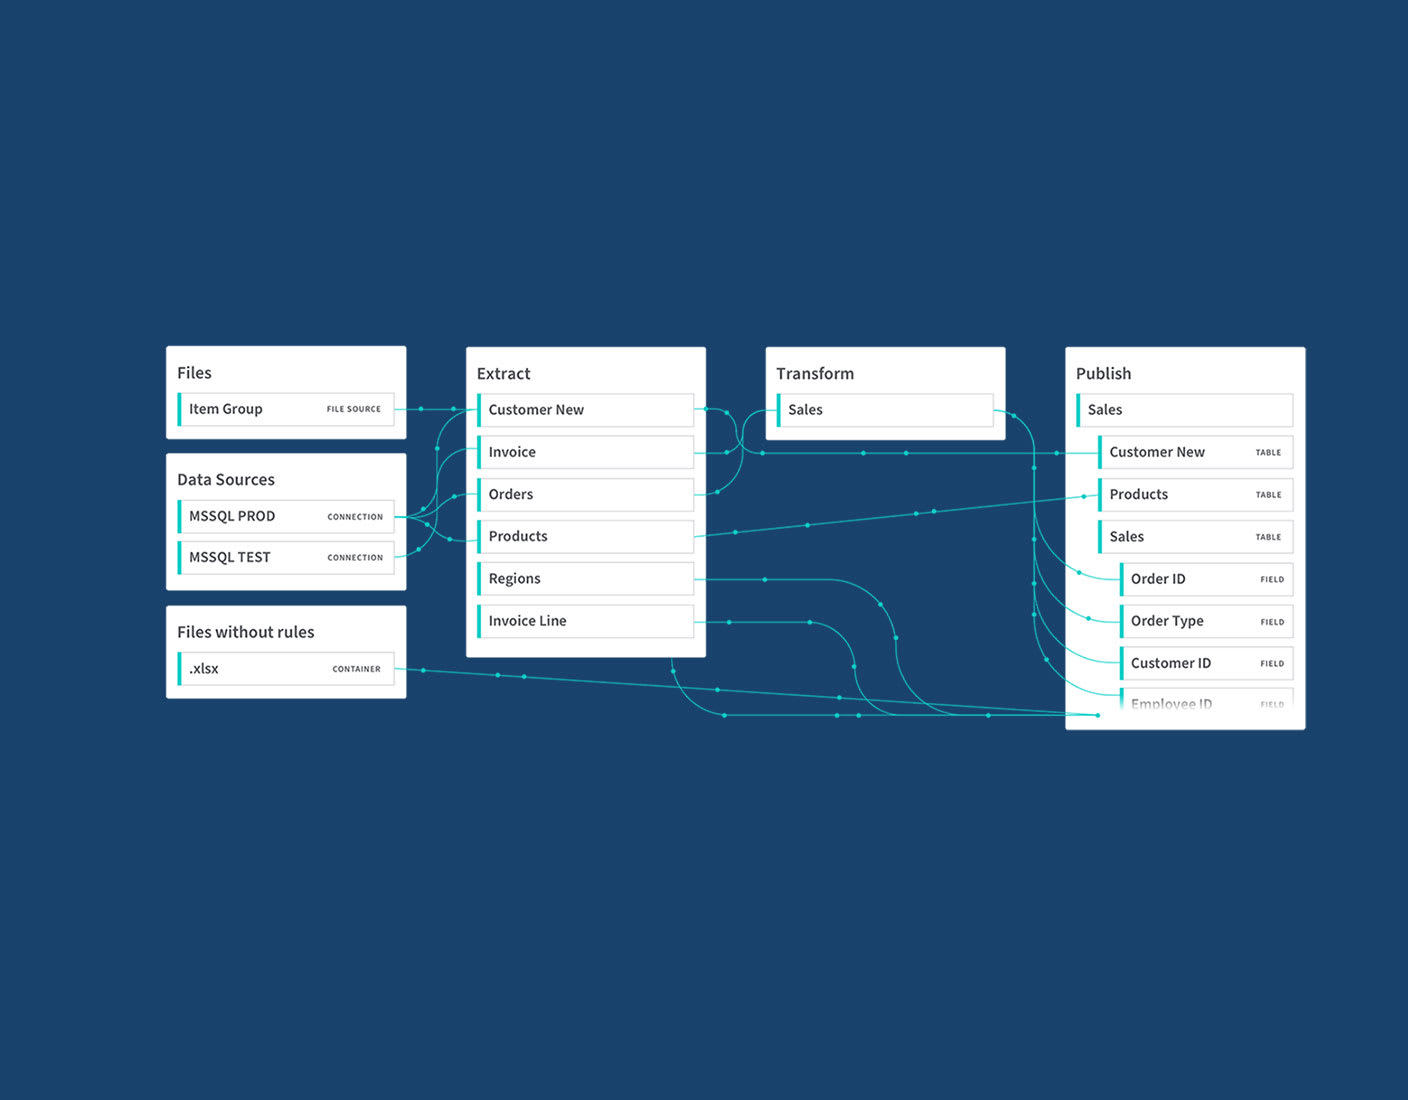
Treat lineage as a living map, not a wall poster. It should be close enough to the workflow so that non-engineers can use it confidently to understand where the information is coming from.
Next Steps: Data Quality and AI Preparedness
AI is only as good as the data it eats, so there is a common saying: “garbage in, garbage out”, that applies to everything in data and analytics, and that applies even more for AI, that has several unique challenges, and building a strong data foundation is more critical than ever, because you want AI to give your team and business correct and concise outputs. Metrics like validity and accuracy can be critical to ensure that the information you are getting has actual value.
If you’re reading this and thinking, “This is exactly the problem my team has, but I don’t know where to start,” we can help you get started.
Data Quality Health Checks: Get Started Today
That’s why we offer Data Quality Health Checks at DI Squared. It’s a structured and straightforward way to:
- Benchmark your data across the six key dimensions of quality.
- Identify both the quick wins and the areas that pose the biggest risks.
- Build a practical, actionable roadmap to establish trust in your data.
If improving analytics ROI or preparing your organization for AI is on your roadmap, let’s talk. The sooner you improve your data quality, the closer you are to gain more value on your data.
.jpg)